

Last week I was sick and the markets were sick but I made a lot of progress on building machine learning models, which I’ll recap over 3 posts.
Also - I am not happy with these videos!!! They will be improving.
Anyway….
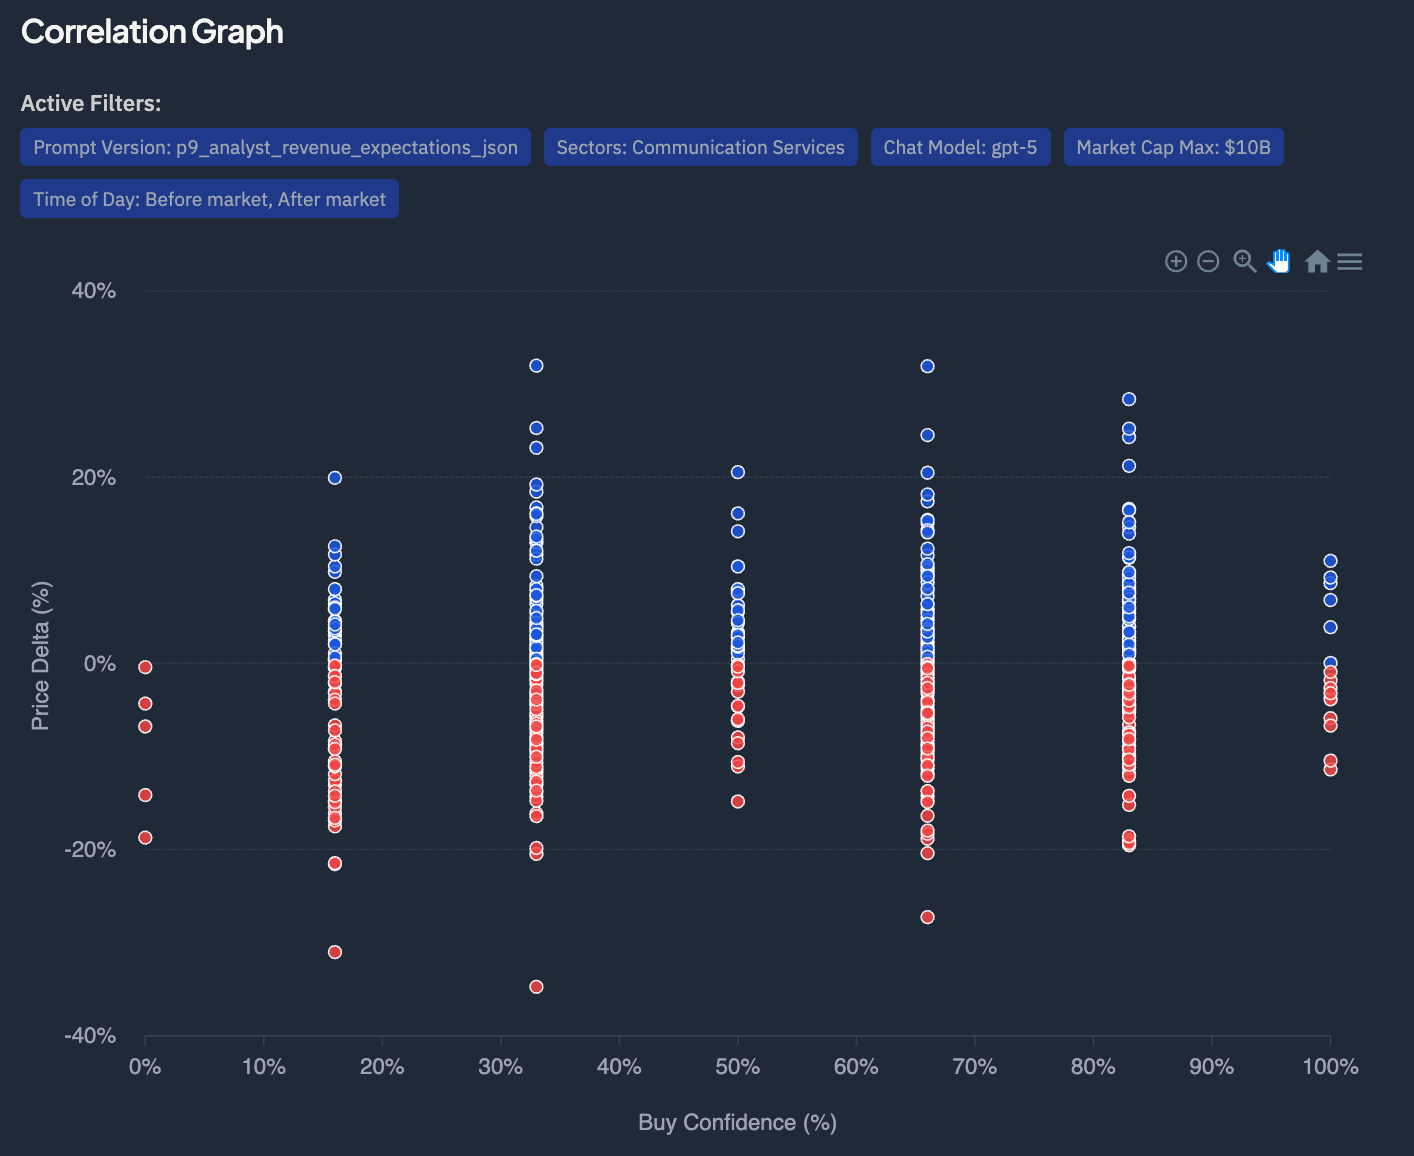
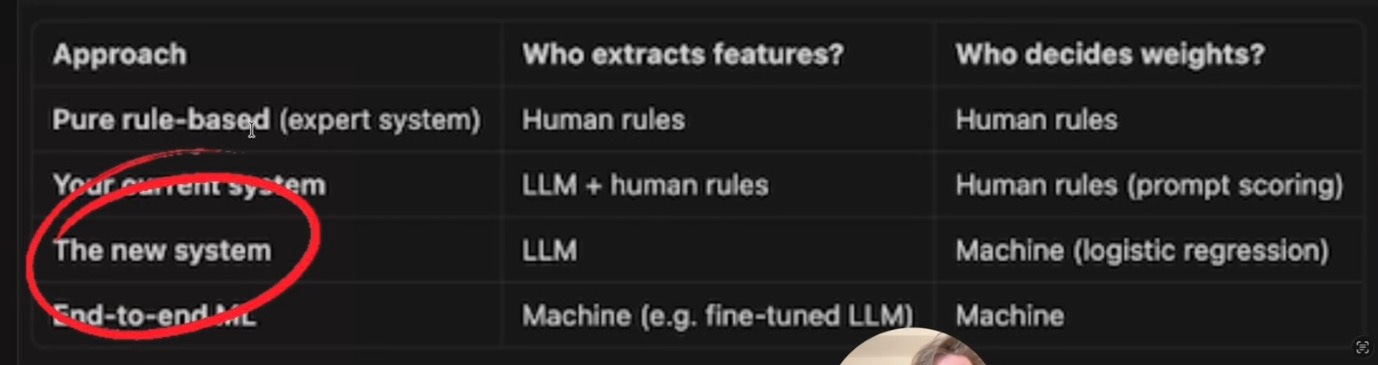
My old approach was to ask the LLM for a buy confidence based on the earnings transcript, with different prompts highlighting different signals. The problem was that LLMs are not great at returning this type of numeric rating. And the lack of correlation I was seeing proved that…
“The new system” is quantitative signal generation or alpha signal modelling — using structured features derived from earnings calls, technicals, and fundamentals to predict short-term price direction.
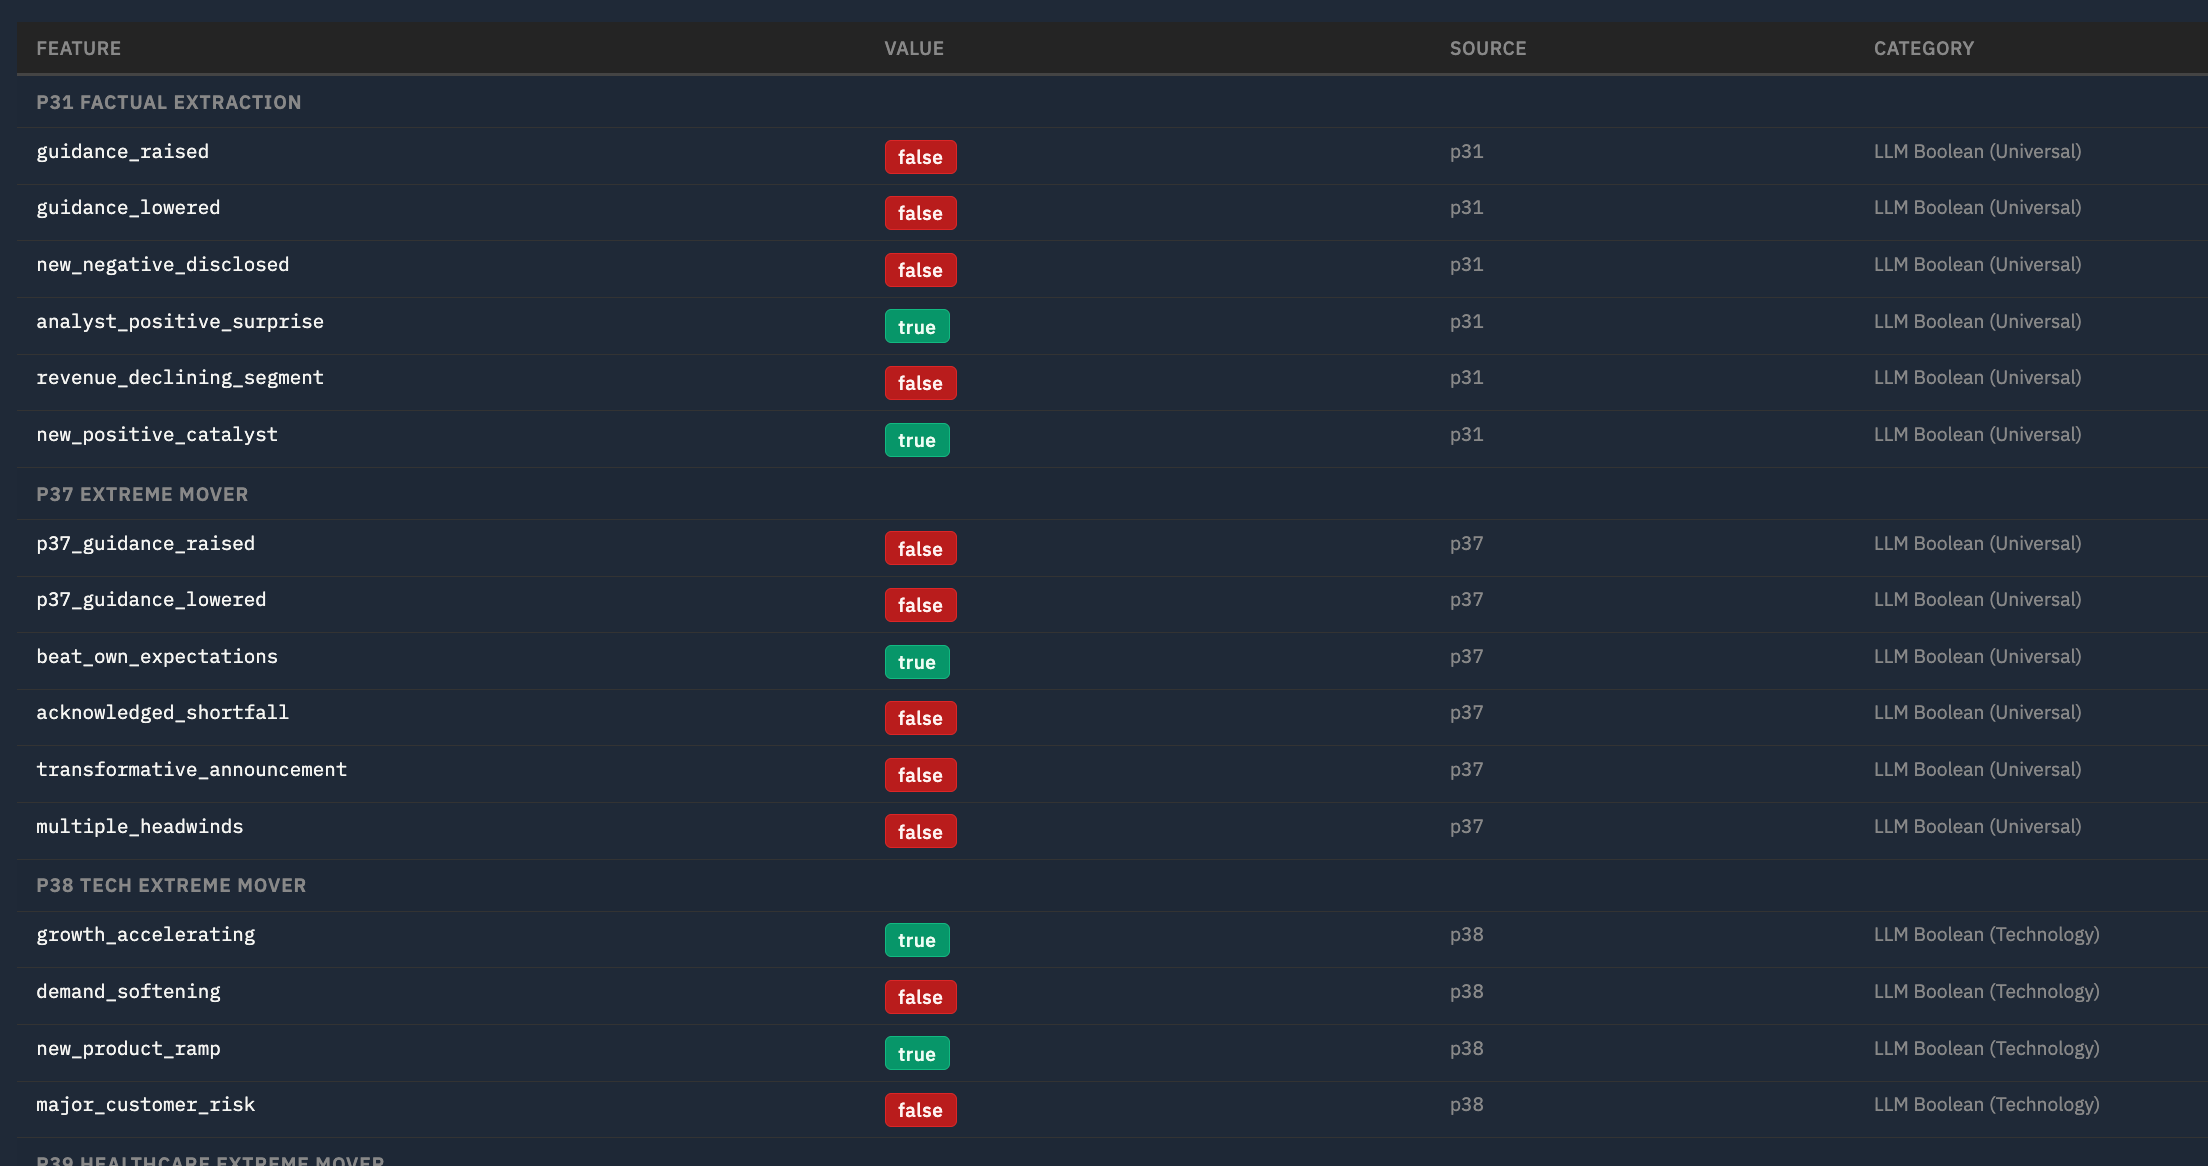
What LLMs are very good at is extracting information from text. Reading 25,000 transcripts and creating around 200 features from each took a couple of days and cost less than $100, with gpt-5-mini anyway.

Example features are
guidance_raised: Did management explicitly RAISE revenue or earnings guidance for next quarter or full year?
revenue_declining_segment: Is revenue declining YoY in one or more major business segments? Must be explicitly stated as declining versus prior year.
beat_own_expectations: Did management state results EXCEEDED their OWN internal expectations or prior guidance? Look for “above the high end of our range”, “exceeded our own expectations”, “ahead of plan”. Beating consensus alone does NOT count.
And there are also macro market features for that day:
macro_risk_off: Is pre-market sentiment risk-off? True if overnight futures are notably down, safe-haven assets (bonds, gold, yen) are rallying, or there is a clear flight-to-safety tone in pre-market coverage. Normal fluctuations are false.
fed_or_rate_event: Is there a Federal Reserve event today — FOMC decision, Fed minutes release, Fed chair speech, or any major central bank rate decision (ECB, BOJ, BOE) that could move US markets? Scheduled events only.
geopolitical_escalation: Has there been a significant geopolitical escalation overnight — military conflict, new sanctions, terrorist attack, political crisis, or diplomatic breakdown that is leading pre-market news coverage and could materially impact markets?
vix_elevated: Is the VIX (or expected volatility based on pre-market conditions) notably elevated — above 20, or spiking significantly from recent levels? Normal VIX in the 12-18 range is false.
Finally, with have some traditional quant features and other metrics :
delta_sma_200_50 - simple moving average of past 200 days vs more recent 50
hist_avg_return_eod - average EOD return
qa_word_count - how many words in Q&A portion of earnings call
So every quarter now has the following…
Next I use traditional supervised learning machine learning, supervised in this context meaning I gave the model what the result was (did it end up or down) and it tries to learn how to predict it.
To start with I’m using gradient-boosted decision trees (GBDT) for binary classification ( i.e. there are only two possible predictions, stock will go up or go down).
Two key metrics
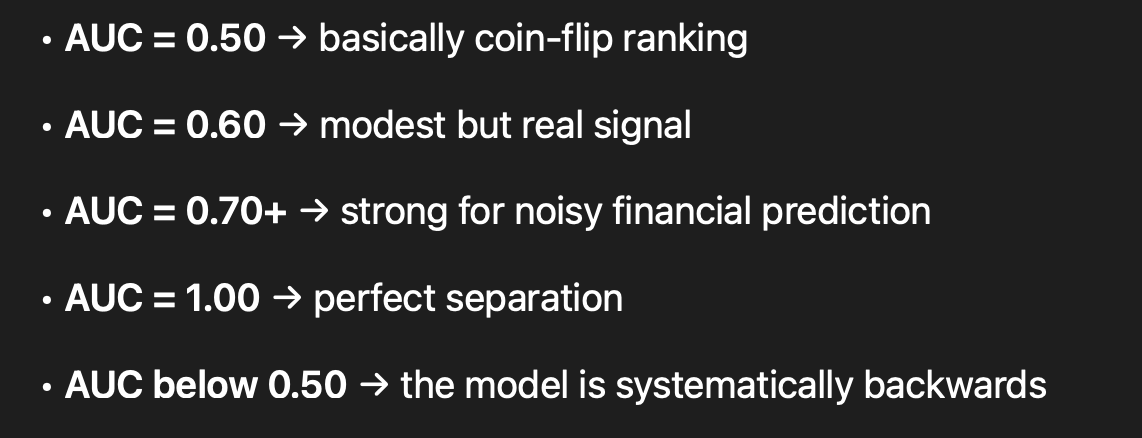
AUC (Area Under the ROC Curve) measures how well the model separates stocks that go up from stocks that go down, across all possible confidence thresholds. An AUC of 0.50 means the model is no better than flipping a coin — it can’t distinguish winners from losers. An AUC of 1.0 means perfect separation. In financial markets, where randomness is extreme and most signals are weak, anything consistently above 0.60 is meaningful edge.
Another metric is Win rate i.e. of all the trades the model actually recommends (above a chosen confidence threshold), what percentage ended up profitable? For example, at a 0.70 confidence threshold if we have a 68.6% win rate that means 7 out of every 10 trades close up. Higher thresholds give better win rates but fewer trades: at 0.70 we get 433 trades with 68.6% wins, while at 0.75 we get 293 trades with 72.7% wins. The art is finding the sweet spot where win rate, number of trades, and average return per trade combine to maximise total profit after transaction costs.
Baselines
Initial models trained on ~21k rows with time-based splits. EOD achieved AUC EOD 0.649, 7d 0.612, 28d 0.615. Solid but modest.
Micro-cap stocks were the most difficult to predict so in the end I excluded them for now.
Next decided we widened hyperparameter search and switched to LightGBM, a more advanced GBDT that was developed by Microsoft in 2017.
We also added 57 new features (volatility metrics, company earnings stats, financial ratios, insider/analyst data).
EOD AUCs stayed around 0.643-0.645. We then trained intraday models (2h, 3h, 4h) which appeared to dramatically outperform — the 4h model showed AUC 0.750…. but there was a big issue…. for next time.
Part 2 tomorrow.
