

Predictably I set it off trading and immediately had a bad day. I had an issue with incorrect calculation of buying power when there are lots of positions, this logic has got really quite complicated and it was hitting a ceiling and not opening all positions - of course, the good positions didn’t open 🫠
But… this is just the beginning
In the last post I got to a decent 0.60 AUC baseline with binary classification machine learning i.e. can the system accurately guess if the stock will go up or down.
However, I had some operational issues, and probably the biggest thing is we have a full-blown war going on right now for which I just don’t have training data since we haven’t had a war as big or dumb as this for a long time.
However… with the back test I wanted to see if I could push model performance and with the help of Opus 4.6 tested some new ideas.
Now for some quick experiments to increase the AUC and win rate.
Experiment 1: Remove ‘post event’ metrics
The audit flagged that delta_premarket, delta_transcript, delta_gap, premarket_volume_pct and related features happen AFTER the earnings call. They’re valid if if we trade at market open when the premarket reaction is known, but they create two problems:
They dominate the model —
delta_premarket_positiveis currently the #1 feature in the 4h modelThey conflate “the model learned something from the transcript” with “the market already reacted”
We trained two XGBoost EOD models to compare the effect of premarket/gap features on prediction accuracy:
With premarket features (the standard model) — uses 192 features including gap_pct, delta_premarket, premarket_volume, etc. Result: Test AUC 0.627, 70.3% win rate at 0.70 threshold, +1.95% net avg return.
Without premarket features — drops 27 post-event price features so the model only uses transcript/LLM signals, fundamentals, and historical data. Result: Test AUC 0.552, 61.0% win rate at 0.70 threshold, +0.82% net avg return.
The point here is that a no-premarket model could let us place trades before the market opens (out-of-hours), as soon as the earnings transcript is available — we wouldn’t need to wait for premarket price action. The tradeoff is a significantly thinner edge (~7.5 AUC points lower) though.
Prices are less liquid out of hours so this is risky territory but perhaps worth pursuing.
Both are set up as analysts that do not trade so we can paper test.
Experiment 2: Feature Pruning & Premarket Experiment
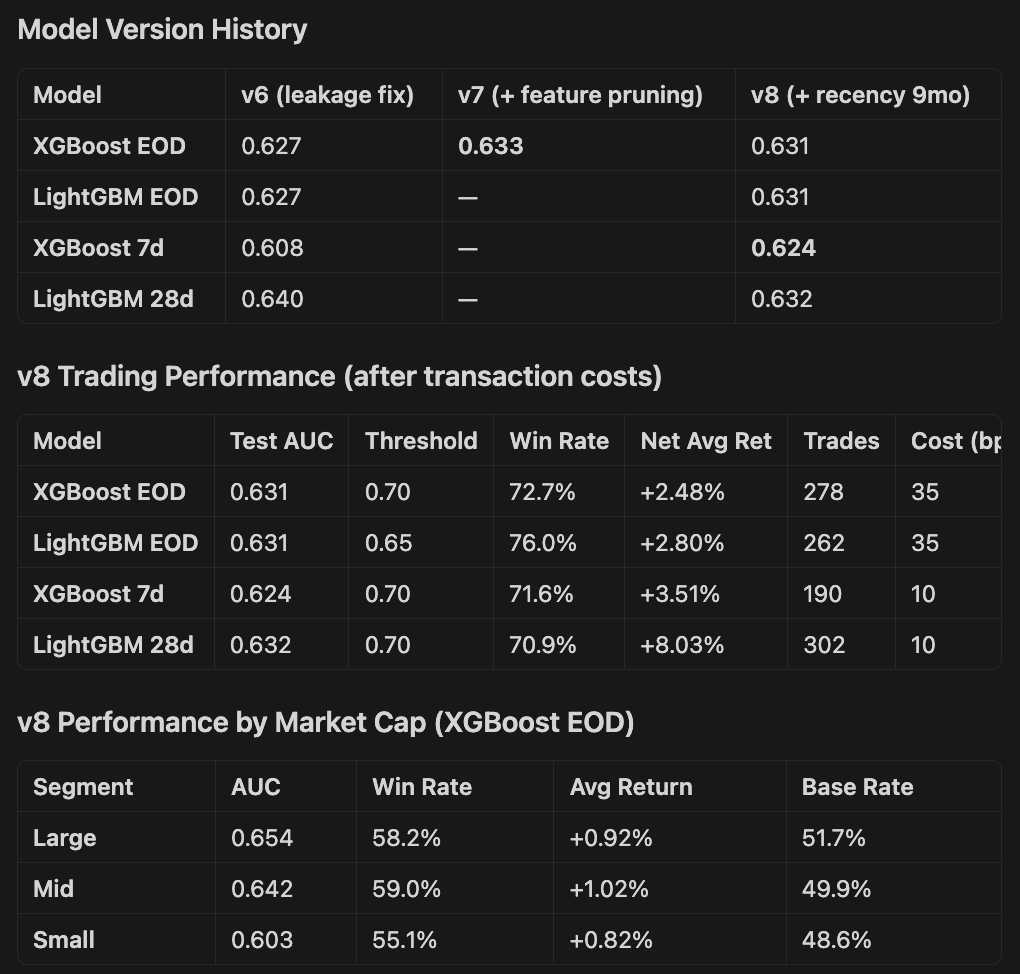
A new model was trained by pruning from 192 features down to just 23.
This aggressive pruning improved test AUC from 0.627 to 0.633 and win rate at the 0.70 confidence threshold from 68.6% to 71.6% (+2.28% net average return per trade, 225 trades).
The simpler model is less prone to overfitting noise and performs better across all market cap segments, with large-cap AUC at 0.656 and mid-cap at 0.636.
The most powerful signal by far is the premarket price reaction — delta_premarket_positive alone has nearly 2.5x the importance of any other feature. Combined with the raw premarket delta, transcript-period price move, and the 50-day EMA relative to premarket price, market reaction features dominate the model. This confirms that the market’s immediate overnight response to an earnings call is the strongest predictor of where the stock closes that day.
Beyond price action, the model relies on a company’s earnings track record (win rate, consecutive beats, typical move size), LLM-extracted transcript signals (management confidence, new negatives, backlog weakness, cost control, guidance beats), timing (before vs after market), and a handful of industry-specific effects (Semiconductors, Restaurants, Biotech, Solar behave differently post-earnings).
Market context like VIX and market cap category are also important.
The key insight is that 23 features carry virtually all the predictive signal — the other 169 were adding noise, not information.
Experiment 3: Temporal feature weighting
Give more weight to recent quarters vs older ones. Market regimes change — a model that overweights 18-month-old patterns may underperform on current conditions.
We added temporal recency weighting to the training pipeline that applies exponential decay to sample weights based on how old each training quarter is. With a 9-month half-life, the most recent quarters get full weight while the oldest training data (from early 2024) is down-weighted to about 38% influence. The idea is that more recent earnings patterns are more predictive than patterns from 18+ months ago. We tested half-lives of 6, 9, and 12 months against a no-recency baseline on XGBoost EOD, and 9 months was the clear sweet spot — improving test AUC by +0.012 over baseline at the same iteration count.
We then combined recency weighting with the feature pruning approach to produce new v8 models across all four targets.
The results: XGBoost EOD landed at 0.631 test AUC with 72.7% win rate at the 0.70 threshold (+2.48% net after 35bps costs), LightGBM EOD hit 0.631 with an impressive 76.0% win rate at 0.65, XGBoost 7d improved significantly to 0.624 (up from 0.608 in v6), and LightGBM 28d reached 0.632 with 70.9% win rate and +8.03% average net return per trade.
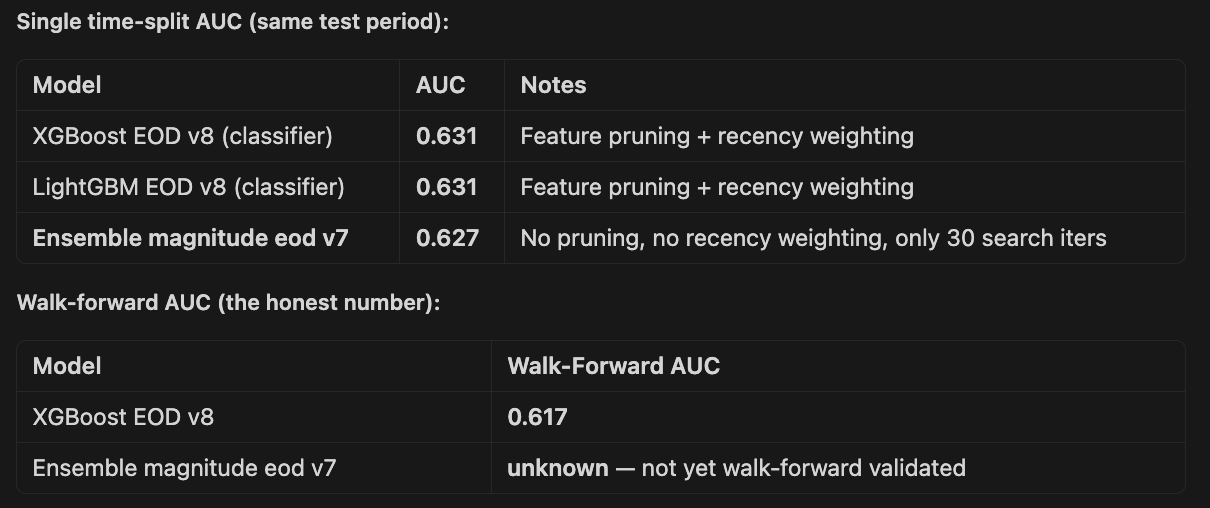
Experiment 4: Walk-forward validation instead of single train/test split
Right now I have one split (e.g. train before Oct 2025, test Oct 2025 – Jan 2026). This is a single window that could be unusually easy or hard.
Implementing rolling walk-forward (e.g., train on 12 months, test on the next 2 months, slide forward) gives 5-6 evaluation windows and much more robust AUC estimates.
The findings were:
XGBoost 4h and XGBoost EOD are the strongest — both have pooled AUC around 0.605-0.608, confirming genuine short-horizon signal
Signal degrades with longer horizons — 7d drops to 0.579, 28d to 0.557. This makes intuitive sense; earnings-driven alpha fades as macro/sector noise dominates
All models show the same pattern — weak early folds (0.55) when training data is sparse, strong later folds (0.63-0.66) once 10k+ samples available. More data = better signal, might need to go back further in time.
CV AUC is consistently ~0.62 across all models, while test AUC varies more, confirming some regime sensitivity
Despite modest AUCs, the trading economics work — 60-67% win rates at high thresholds with positive net returns after costs
XGBoost consistently edges out LightGBM on walk-forward test AUC across all horizons
The walk-forward results validate that the currently trading XGBoost EOD model is indeed best.
Experiment 5: Different time horizons
Currently I try and predict EOD prices, but there are arguments for…
Closing sooner e.g. 2h, 3h, 4h. Most of the bump in good earnings happens at the start of the day, so close out sooner.
Or closing later - in the last post I mentioned that 28d models performed best, if I can find a capital efficient way of doing this it might be a better route.
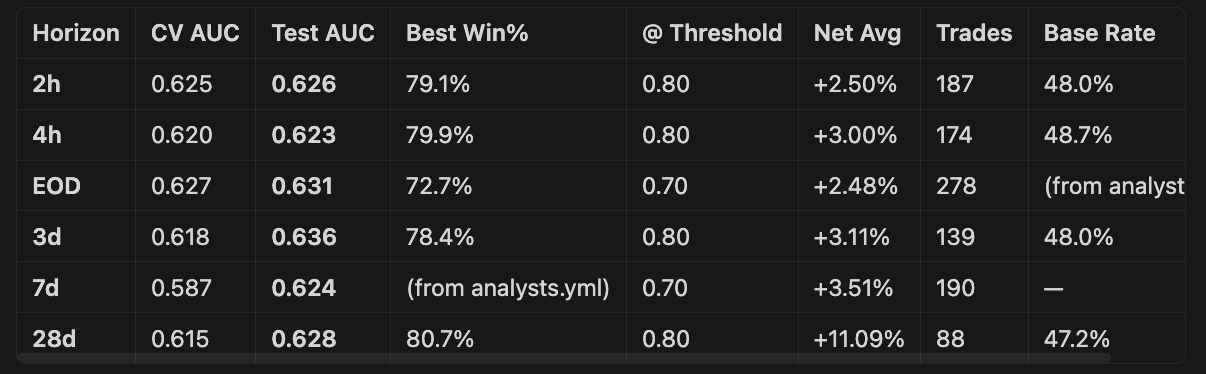
3d is the best AUC at 0.636 — a new horizon we hadn’t trained with v8 before.
28d has the highest returns by far — +7.64% net avg at 0.70 threshold with 70.4% win rate (351 trades). The longer holding period allows the edge to compound.
2h and 4h are very similar in AUC (~0.62) but the high-confidence thresholds (0.75-0.80) produce excellent win rates of 72-80%.
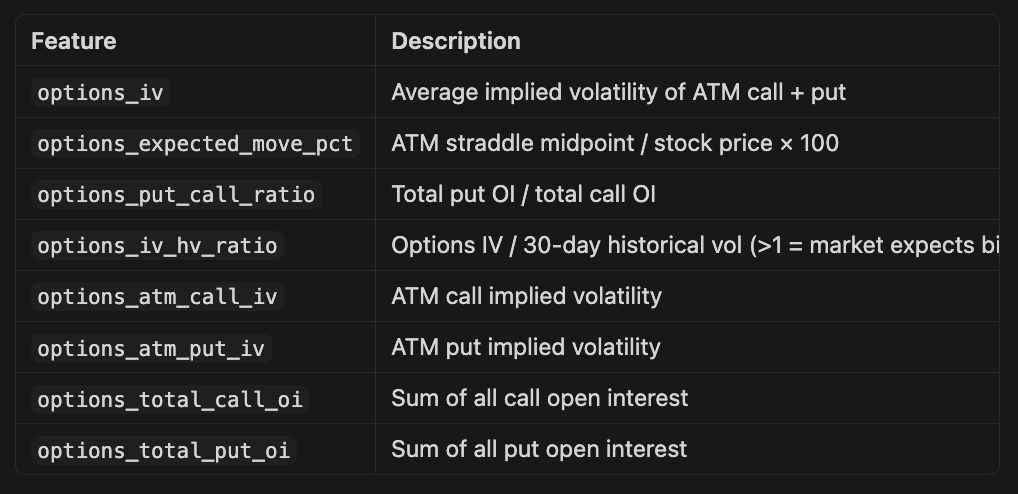
Experiment 6: Add options-derived features
Added options features below, sadly it’s not possible to backfill these from my current broker so we will have to experiment going forward.
Experiment 7: Predict magnitude, not just direction
Instead of binary up/down, train a regression model on return_EOD directly, then threshold at trading time. Or use a two-stage approach: classifier for direction + regressor for magnitude. This captures more information from the target and can improve calibration.
I had high hopes for this, but actually it was roughly comparable or slightly worse than the best binary classifier.
Still to try...
More historical data — Going back to 2023. More data always helps.
Better LLM features — use a more capable model for extraction. The feature extraction uses gpt-5-mini. Upgrading to gpt-5 (or even gpt-5.4) for a subset of key features might extract more nuanced signals.
More LLM features — Short interest changes pre-earnings, social media sentiment, news volume. All require new data sources.
Sector-specific models. The sector AUCs vary significantly (Utilities 0.72, Basic Materials 0.55). Training dedicated models per sector group (e.g., Tech+Comms, Healthcare, Financials, Everything Else) could capture sector-specific patterns that a single model averages out.
Ensemble of diverse model types - XGBoost and LightGBM are similar (both Gradient Boosted Decision Trees). Adding a genuinely different model — a neural network, or a linear model with different feature engineering — into an ensemble could capture complementary signal.
I’ll also keep an eye on those 28 day models , I could pursue a strategy using options that would be capital efficient and perhaps better alpha.
OK - slightly boring, but don’t worry, I have some more fun stuff to come.
I’m hoping these marginal improvements give me a model that generates alpha whilst I work on everything else (and avoid going broke. )
